Revenue Forecasting
August 2022 - September 2024

The Problem
Small cities often lack the resources to have dedicated analysts on staff, which makes it difficult to access robust forecasting models.
In addition, complex Excel workbooks make it difficult to paint a coherent picture of the forecast, leading to a lot of back-and-forth when presenting to City Council.
Case Study Details
Team:
1 designer, 1 project manager, offshore development teamMy role:
Lead designer, user researcherProcesses:
User interviews, concept testing, user flows, wireframes, mockups, prototyping, usability testingThe Solution
Providing a robust and visually focused forecasting tool will make forecasting accessible, especially to small cities or counties without dedicated analysts.
With built-in machine learning models, as well as more familiar ones such as historical averaging, forecasters can explore projection techniques that might ordinarily be out of reach.
Process
Proof of Concept
Before my arrival, an extensive proof of concept design had been created by a UX contractor. Picking up where he left off, I continued validation through user interviews.
I also explored which surface area would be best for this solution to be built in, and collaborated with the PM on feature priotization for MBI 1.
Design iteration
After interviews were complete, I iterated on the designs. My focus areas were to create a new user flow that worked with the scaled back feature set, and improve on a few rough areas from the proof of concept designs with wireframes.
The original concept was very open and I had concerns aobut users knowing where to go next. I explored concepts for a stepper, but it seemed too linear for how the people we interviewed described their forecasting process.
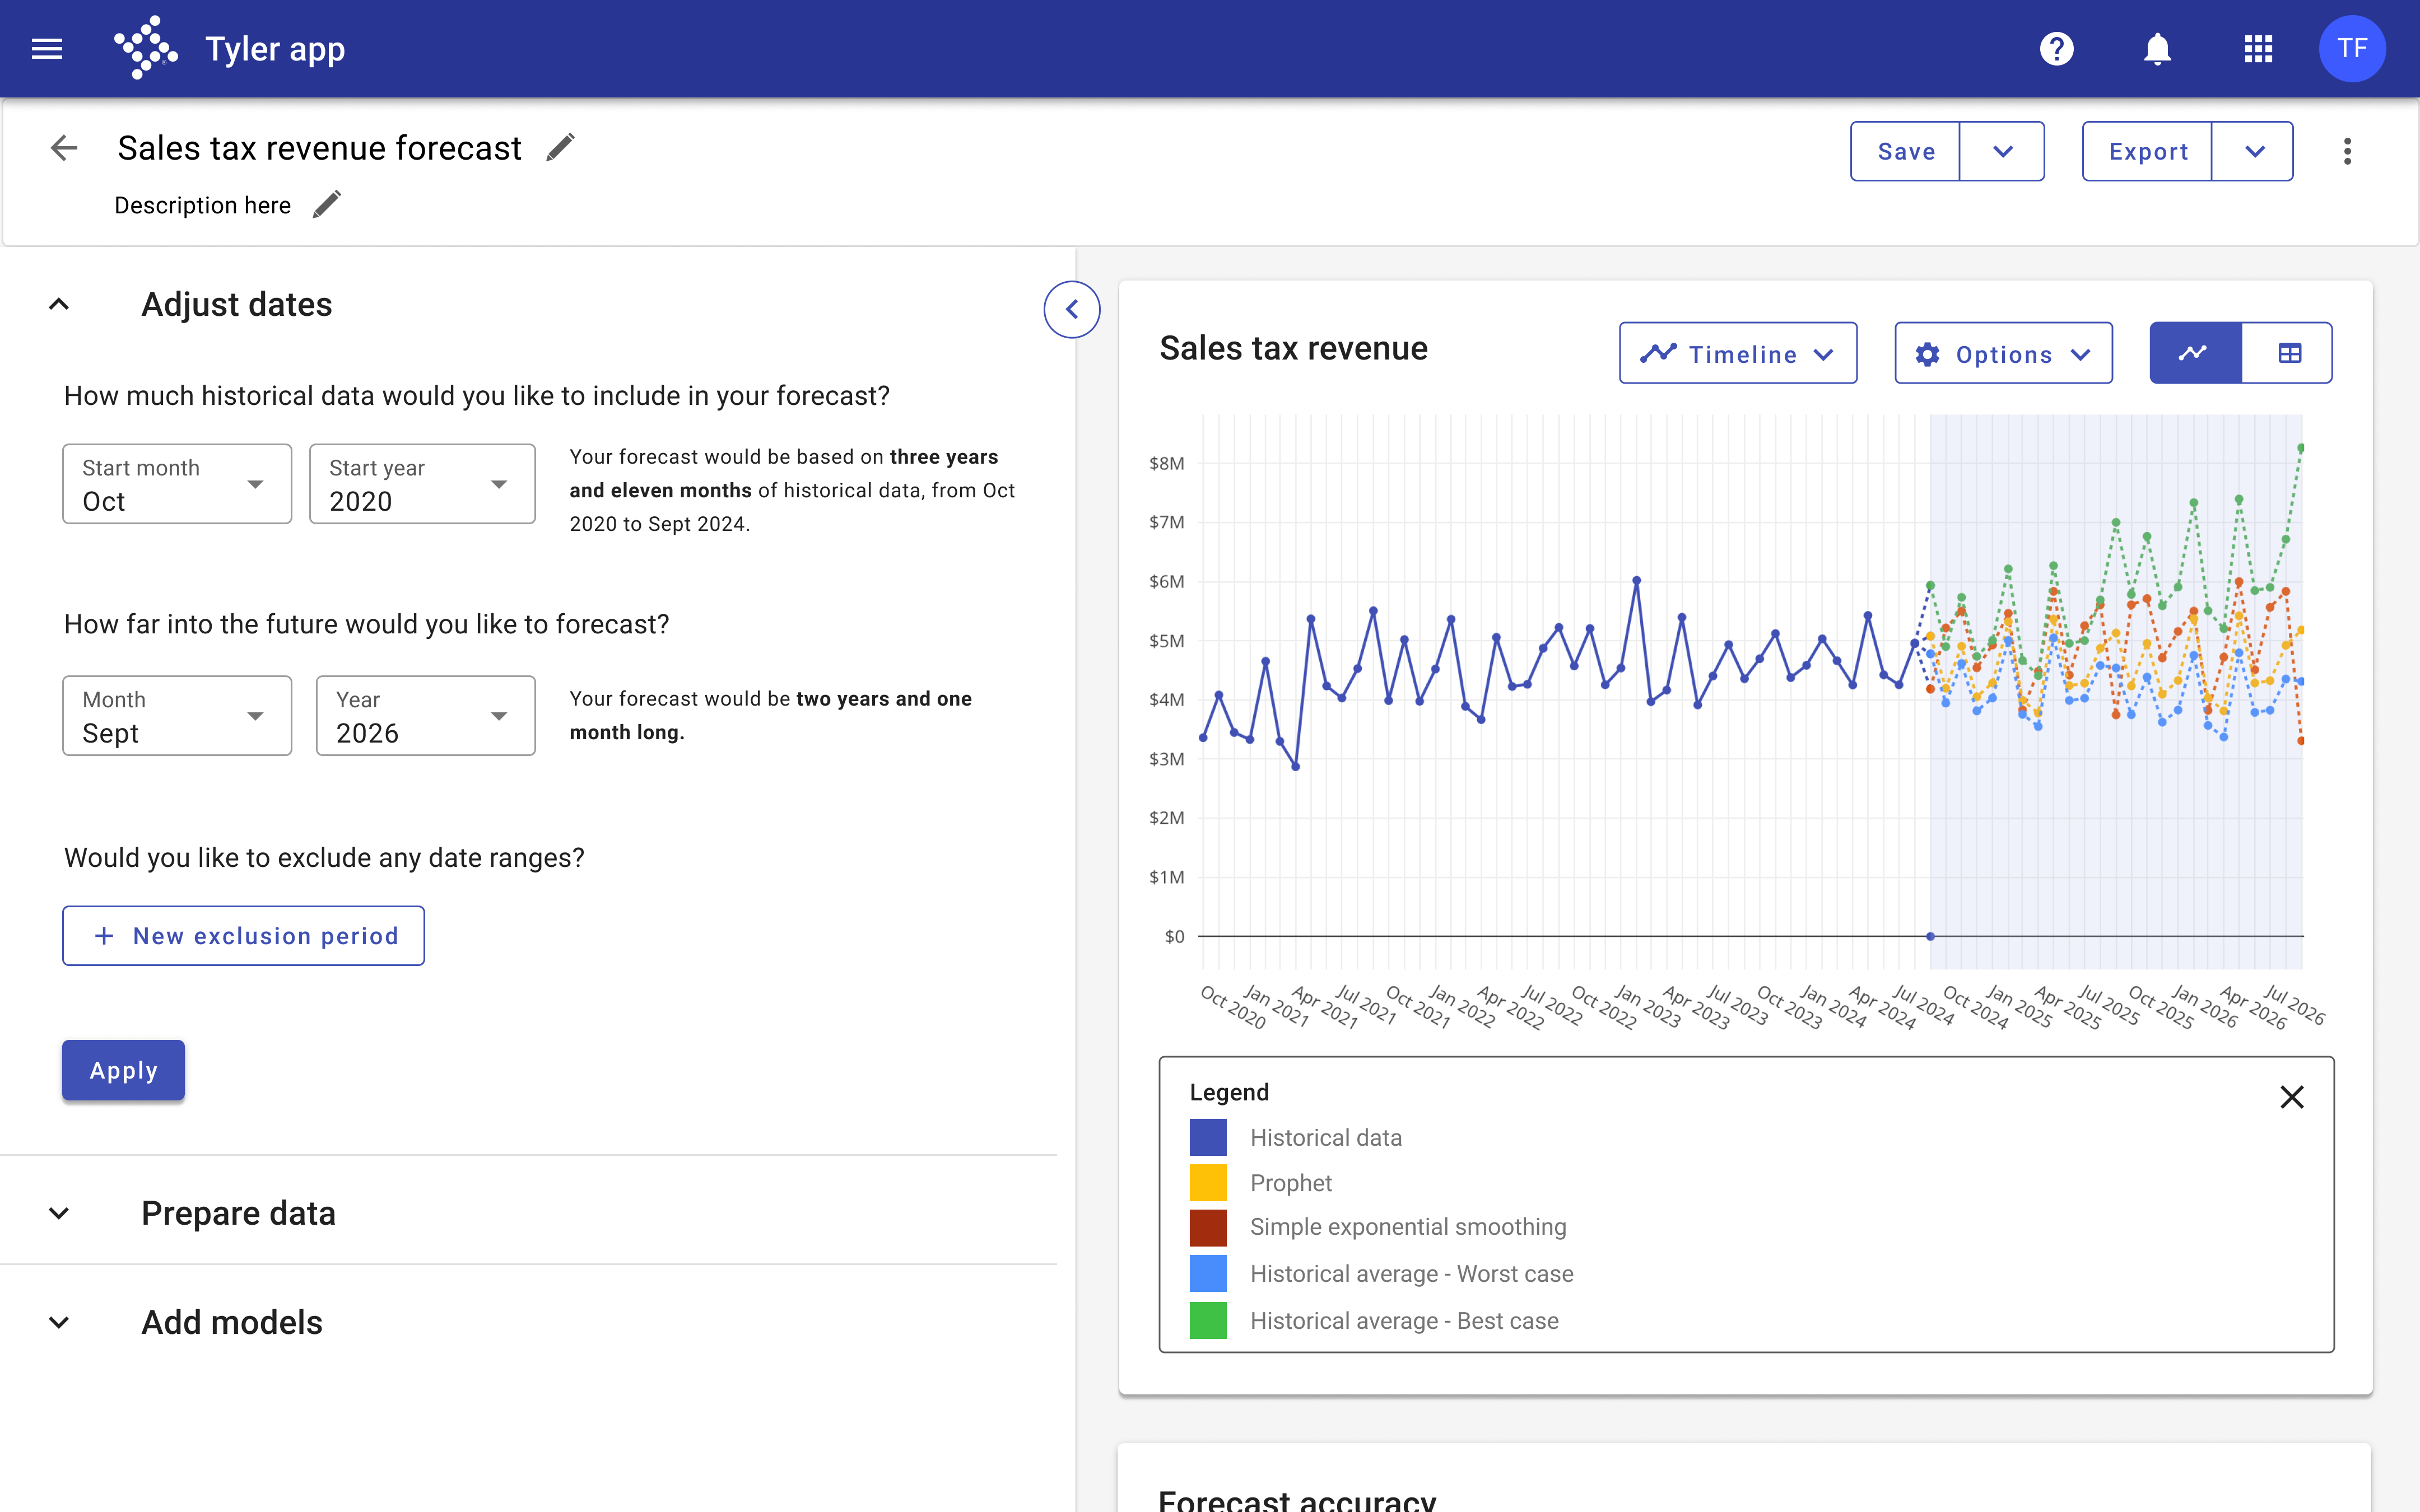
I ultimately landed on a sidepanel layout that allows users to jump between the suggested steps, as well as collapse it for presentations.
What-if Scenarios
One of the proof of concept features that needed further validation was the idea of creating "what-if" scenarios for forecasts. This involves layering assumptions of various external factors on the prediction models, and is often a key factor in storytelling for budget presentations.
I created a clickable prototype and research script for assessing how users expect models and assumptions to interact. The study design also included questions to determine what would be most valuable for scenarios to support - is it the ability to pull external datasets in, or finetuned control of the model inputs?
For MBI 1, we left it at the ability to duplicate and edit inputs. Research on this feature was deprioritized partway through, but I expect that it will picked up again for a future iteration of the product.
Usability Testing
After internal design feedback, I created high fidelity designs and a clickable prototype for usability testing in key areas.
As we approached the release date for MBI 1, I also created a plan for user behavior insights using Pendo. Starting from a set of questions, I determined which UI elements would be optimal to tag.
I created Pendo tracking for the areas I could, and collaborated with developers to add track events where it was needed programatically.
Reflections
Revenue Forecasting is one of many advanced analytics offerings at the company, and it was a pleasure to work on it. I gained experience with a side of finance that was new and exciting to me, as well as a better understanding of many statistical and data science best practices.

